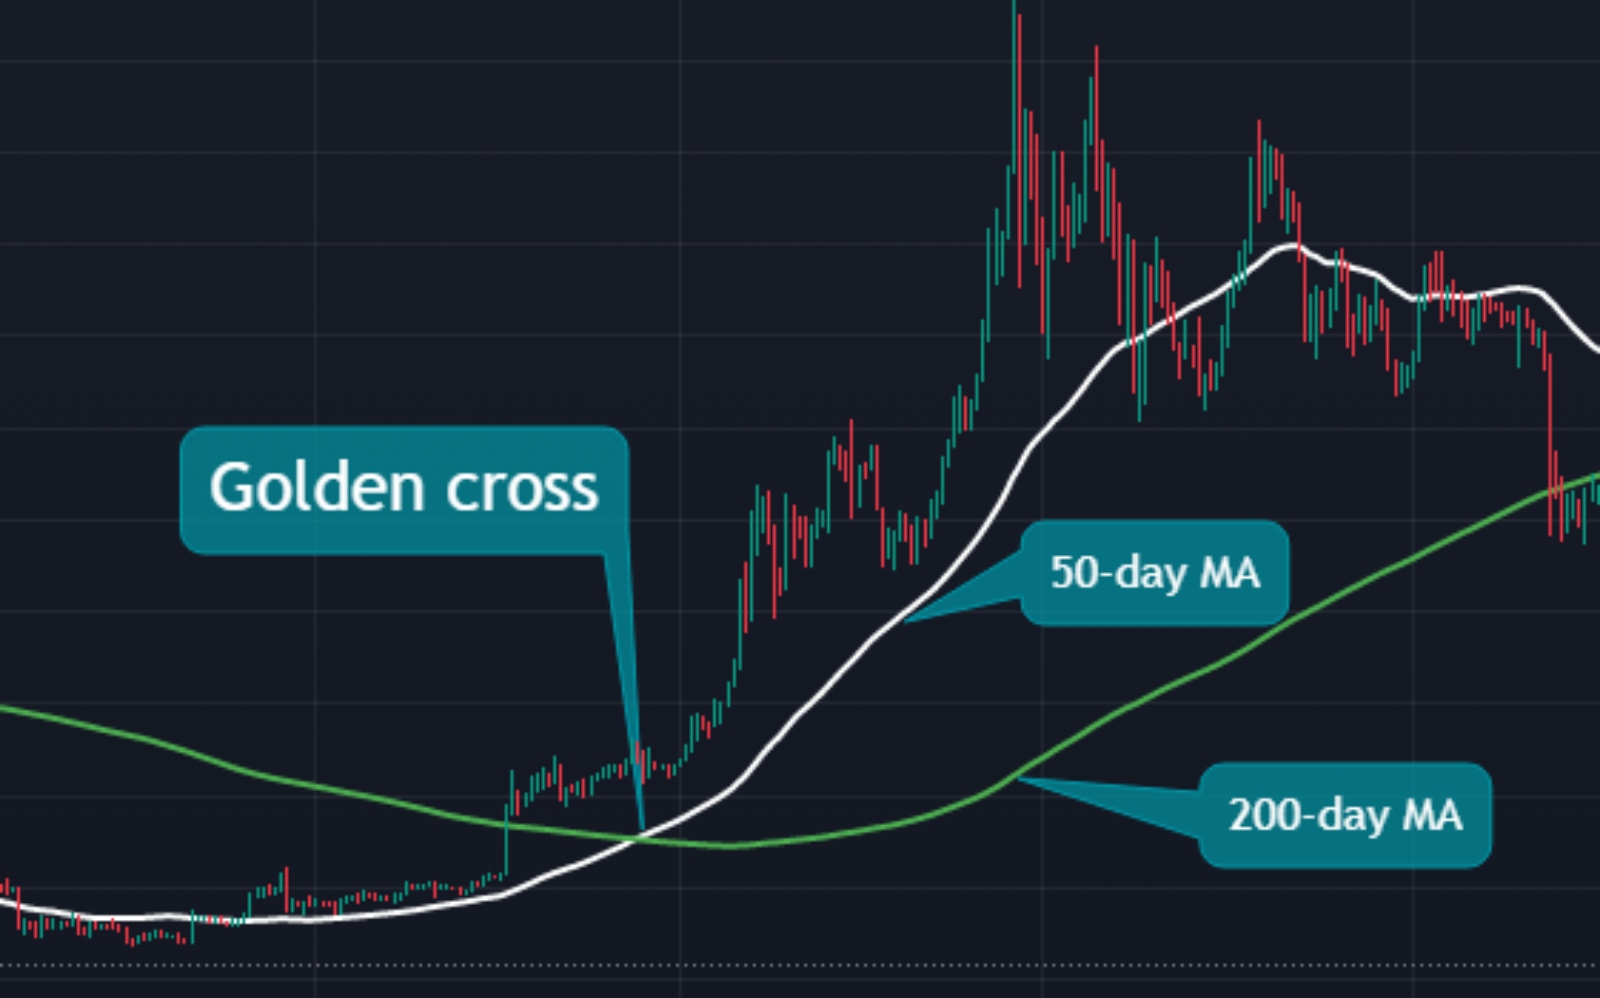
The Golden Cross is a popular technical analysis pattern that signals a potential bull market. It occurs when a short-term moving average (such as the 50-day moving average) crosses above a long-term moving average (such as the 200-day moving average). The cross is referred to as ‘golden’ because it is often seen as a bullish sign that indicates a potential increase in upward price momentum.

Golden Cross Can be Used to Confirm a Bullish Market Trend
Investors and traders use the Golden Cross as a way to confirm a change in market trend, with the short-term moving average acting as a trigger for the long-term moving average to follow. The pattern is often used as a buy signal, as the long-term moving average acts as a confirmation that the trend has indeed shifted to the upside.
The Golden Cross is considered a long-term trend reversal pattern, which makes it a useful tool for both short-term traders and long-term investors. For short-term traders, the Golden Cross can be used to enter a position, as the pattern indicates a potential upward trend. For long-term investors, the Golden Cross can be used to confirm a shift in market trend and to adjust their investment strategy accordingly.
A Golden Cross Should Be Used With Other Indicators and Charting Techniques
However, it is important to note that the Golden Cross is not a guarantee of future market performance. While it is a widely recognized and followed pattern, it is not a perfect indicator. For example, there have been instances where the Golden Cross has signalled a bull market, but the market has still fallen.
It is also important to consider other factors when interpreting a Golden Cross pattern. For example, the overall market sentiment, economic indicators, and news events can also affect market trends. As such, it is essential to consider the Golden Cross in conjunction with other technical and fundamental analysis tools to gain a comprehensive understanding of market conditions.
In addition, once a Golden Cross is identified, a confirmation should be sought by checking other indicators such as the MACD and RSI and also exploring different time frames.
Summary
In conclusion, the Golden Cross is a widely used and recognized technical analysis pattern that signals a potential bull market. While it can be a useful tool for investors and traders, it is important to consider other factors and use it in conjunction with other analysis tools to gain a comprehensive understanding of market conditions. As with all technical analysis patterns, it is important to exercise caution and not rely solely on the Golden Cross to make investment decisions.
© Solana Daily Brief, Inc. All Rights Reserved. This article is for informational purposes only. It is not to be used as legal, tax, investment, financial, or other advice.