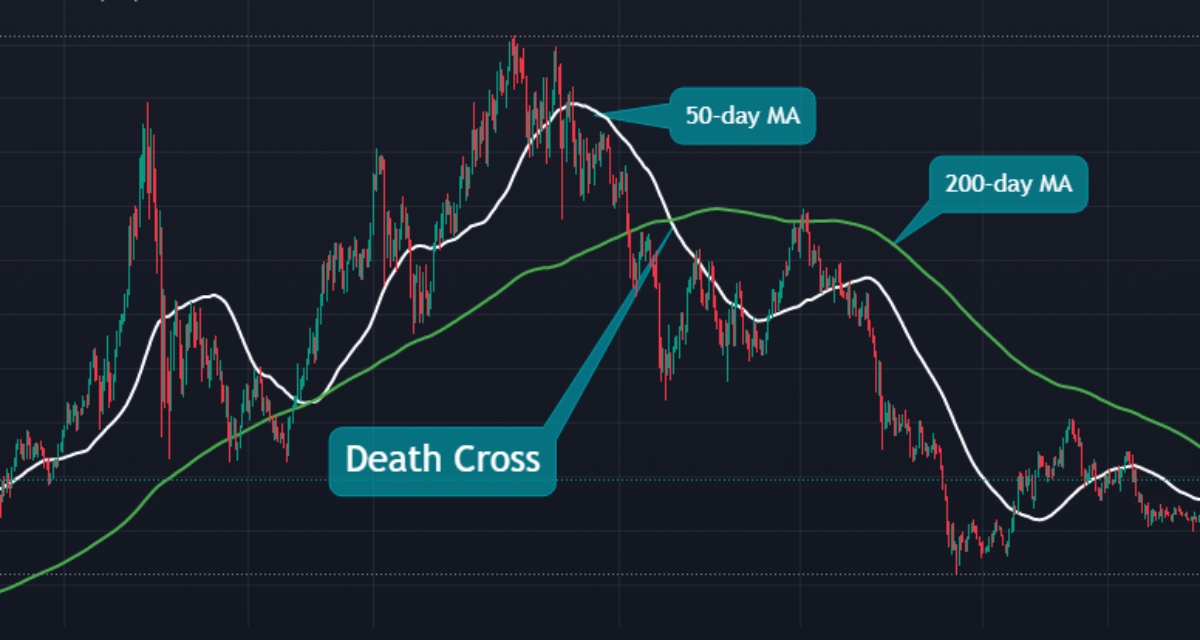
Death Cross is a bearish technical analysis indicator used in stock trading and stock markets. The Death Cross is formed when a short-term moving average (such as the 50-day moving average) crosses below a longer-term moving average (such as the 200-day moving average). This signals a potential trend reversal from bullish to bearish and is often used by traders as a sell signal.

A Death Cross is Usually a Bearish Signal
The Death Cross is considered a bearish indicator because it suggests that the momentum of the stock is shifting from bullish to bearish, and that the price is likely to continue to fall. This can be a useful tool for traders to identify when to sell a stock or to avoid buying a stock that may be in a downtrend.
Death Cross Should be Used Alongside Other Indicators
However, it is important to note that the Death Cross is not a guarantee of a bear market and that other factors, such as economic data and market sentiment, should also be considered when making trading decisions. Additionally, the Death Cross can sometimes occur during a temporary pullback in a stock’s price, and the stock may continue to rise after the cross.
Another thing to consider when using the Death Cross is that different traders use different timeframes for their moving averages. For example, some traders may use the 50-day moving average for the short-term average and the 200-day moving average for the long-term average, while others may use different timeframes. The choice of timeframes will affect the interpretation of the Death Cross, and traders should choose the timeframes that best fit their trading strategy.
In addition, the Death Cross should be used alongside other time-tested indicators such as the MACD, RSI and MFI.
Summary
In conclusion, the Death Cross is a bearish technical analysis indicator that is used by traders to identify potential trend reversals from bullish to bearish. While the Death Cross can be a useful tool for traders, it is important to consider other factors, such as economic data and market sentiment, when making trading decisions and choosing the moving average timeframes that best fit their trading strategy.
© Solana Daily Brief, Inc. All Rights Reserved. This article is for informational purposes only. It is not to be used as legal, tax, investment, financial, or other advice.